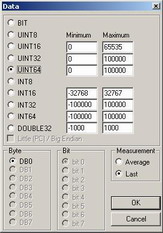
The tool Graph is meant for well arranged data monitoring, which are transmitted by the CAN bus. The tool makes possible on-line monitoring up to 10 quantities of various data types in various CAN messages. For each displayed quantity, there is defined message, which the quantity has occurred in, and furthermore data type and data positions in the message are included. Currently these data types are supported:
- bool
- signed / unsigned int 8
- signed / unsigned int 16
- signed / unsigned int 32
- signed / unsigned int 64
- double 32
Because of some large extent data types it is possible to set limiting interval of the display. It signifies if the quantity type DOUBLE32 and real value of the quantity is within the extent 0.0 – 1000.0, we will set the limiting interval up to this value.
There are stored 1024 samples of each quantity. The sample contains either last registered value in a given time interval or average value during the interval. It is possible to set time interval of the values between 50ms and 1 minute.
Display is carried out in two modes, there has each quantity its own graph in basic mode (see picture 1) and all quantities are displayed on one graph in the mode AllInOne (see picture 2). Configuration of the data setting can be saved in files.
|
|
|
| Picture 1: Graph window, Basic mode | Picture 2: Graph window, AllInOne mode |


There is added export of the graph values to a text file within the version 2.001 (it is possible to import to the program MS Office Excel).
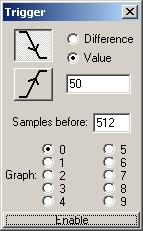
Following the version 2.002 the tool Graph has been supplemented with the function Trigger (see picture 4). Its principle is uniform with similar functions at digital oscilloscopes. The function Trigger permits to stop sampling as the response to an ascending or descending curve of the chosen graph. It is possible to choose curve type, decrease/increase in values between the samples or under/above the level and number of the displayed samples, before the event appearance.
|
|
|
|
Picture 3: Graph window, opened window for data format data putting. |
Picture 4: Trigger |